Trend-momentum strategies trading ETFs were appealing because they generated lower drawdowns and decent returns. Trend-momentum strategies trading stocks, in contrast, were often subject to higher drawdowns, though returns were higher. While I cannot speak for all ETF strategies, my experience shows that ETF strategies have lost their low-drawdown edge. This makes stock strategies more appealing because they now have similar drawdown profiles.
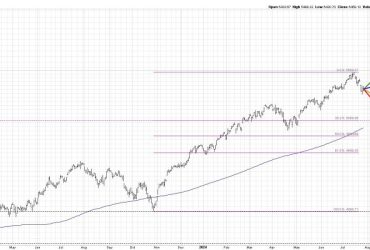
Before looking at ETF performance, let’s look at 1-year (255-day ROC) returns for the S&P 500 SPDR (large-caps), the S&P MidCap 400 SPDR and the Russell 2000 ETF. SPY is down 7.09%, MDY is down 5.28% and IWM is down 11.74%. There is a clear downward bias over the past year. The blue lines mark the middle of the 10-month range for each ETF (mid-June to mid-April). All three are largely range bound. SPY is in the upper half of its range, MDY is just above the mid point and IWM is in the lower half. It is a very mixed market, at best.
Stock-based ETFs reflect the divided market because few failed to generate outsized returns. Trend-momentum strategies depend on outsized returns to generate positive expectancy. Stock-based ETFs are at a disadvantage when the market is divided because they hold a basket of stocks. ETFs cannot avoid the losers in a divided market and this weighs on performance.
The last 12 months have been rough, very rough. The table below shows performance based on the 255-day Rate-of-Change. Of the 170 stock-based ETFs in our Master List, only 1 gained more than 20% (ITB) and only one gained between 10 and 20 percent (XHB). Only 9% of the ETFs were up, 91% were down and the average gain/loss was a loss of 13.74%. That is ugly.
The second line shows comparable numbers for stocks in the S&P 500. The average return is still negative, but much less negative (-6.12% vs -13.74%). 35% of S&P 500 stocks are up over the last 255 days and 65% are down. There is still a negative bias here, but the big difference becomes clear when we look at the outsized gains. 10.74% of stocks are up more than 20 percent and 9.54% are up between 10 and 20 percent (green shading).
Despite a difficult 12 months, the S&P 500 was able to produce more outsized gains than the 170 stock-based ETFs in my universe. Our trend-momentum strategies based on ETFs experienced their largest drawdowns recently. Similar trend-momentum strategies trading S&P 500 stocks performed better because they were able to weed out the losers and catch some outsized gains.
TrendInvestorPro will introduce a trend-momentum strategy for trading stocks in the S&P 500 next week. Also note that there is an expanded version of this article available to subscribers. This article shows profit distributions for a typical trend-momentum strategy, drawdowns for stock/ETF strategies and further explains the Achilles Heel for ETFs. Click here for immediate access.
The Trend Composite, ATR Trailing Stop and nine other indicators are part of the TrendInvestorPro Indicator Edge Plugin for StockCharts ACP. Click here to take your analysis process to the next level.
—————————————


