The U.S. trade deficit widened to a 6-month high and by the most in 8 years. That means that we imported way more goods while our exports declined.
Now, we don’t like to use one economic stat as the end all be all, but this does indeed strengthen our stagflation outlook. The Dollar’s recent strength is a factor as well. Looking ahead, the west coast port labor potential strike could hurt both imports and exports in the coming months.
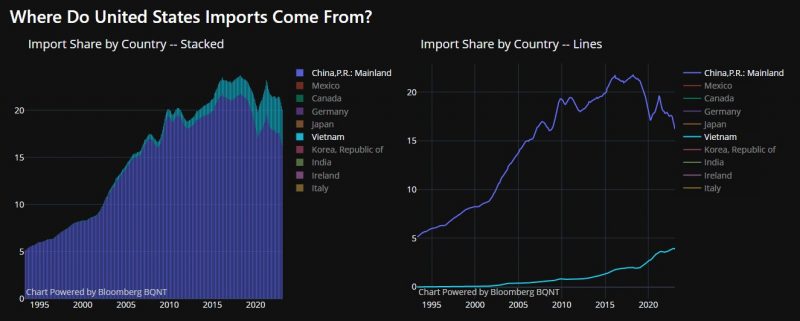
Meanwhile, the chart shows us another interesting trend, one that we have dubbed as the “sleeper trade” for 2023 and beyond. Since we in the U.S. have rising imports, these charts illustrate where we (and other countries) are going for cheap labor and goods. And it is not just to China.
Note the declining dependence on China and the rising dependence on Vietnam for imports.
This is a weekly chart using the ETF VNM for Vietnam.
About the ETF
VNM extends beyond firms domiciled in Vietnam to include non-local companies generating at least 50% of revenues in Vietnam. In doing so, VNM adds exposure to different sectors via companies in other regions. It’s a broad take on the Vietnamese market for those seeking a pure-play fund.
Finance is the top sector in the ETF basket at 51.95%, followed by Consumer Non-Durables at 16.62%. The blue line is the 23-week moving average. Should that clear and confirm by the end of this week, that is a phase change to Recuperation. The last time VNM traded at these levels was the week of January 23rd when the high was 13.17. Should the price hold the phase change and take out the 2023 highs, we will consider that a more bullish sign.
Our Real Motion Indicator tells us that momentum has also cleared its 50-week moving average. Price and momentum are moving in tandem. Nothing pleases us more than when fundamentals and technicals line up.
For more detailed trading information about our blended models, tools and trader education courses, contact Rob Quinn, our Chief Strategy Consultant, to learn more.
“I grew my money tree and so can you!” – Mish Schneider
Get your copy of Plant Your Money Tree: A Guide to Growing Your Wealth and a special bonus here.
Follow Mish on Twitter @marketminute for stock picks and more. Follow Mish on Instagram (mishschneider) for daily morning videos. To see updated media clips, click here.
Mish in the Media
The US dollar rallied following a positive US jobs report last Friday, but could the Federal Reserve’s upcoming interest rate decision halt the greenback’s rise? Mish offers her views on USD/JPY, the S&P 500, and light crude oil futures on CMC Markets.
Mish talks GME (Gamestop) and more on Business First AM.
Where is the US economy actually heading? Rajeev Suri of Orios discusses this question and what trends suggest with Mish in this video.
Mish joins Rajeev Suri of Orios Venture partners to discuss the Fed, inflation, and buybacks in this video on LinkedIn.
In this episode of StockCharts TV’s ChartChats, Mish Schneider and TG Watkins (creator of the Moxie Indicator) sit down for a candid chat about working with other StockCharts contributors. Learn what TGs strategy for trading is, and how the the Moxie Indicator came to be. Mish shares her background and how she got started in the industry.
With Congress having reached a deal after months of debt ceiling talks, what direction could the US dollar move in, and what could this mean for the USD/JPY? Mish explores the market movements in this appearance on CMC Markets.
Mish joins Rajeev Suri of Orios Venture partners to discuss the trend toward a risk-on situation in this video on LinkedIn.
Mish weighs in on the overnight slump across the board on the benchmarks and where the momentum is heading on Singapore Breakfast, available on Spotify.
Mish explains how reversal patterns could come to the fore this week in this appearance on CMC Markets.
Mish joins Rajeev Suri of Orios Venture partners to discuss the possibility of economic stagflation in this video on LinkedIn.
Mish discusses how AI is being used to invest in this article for BNN Bloomberg.
Coming Up:
June 8: Mario Nawfal Twitter Spaces, 8am ET, & Wolf Financial Spaces
June 12: BNN Bloomberg Opening Bell
June 13: Daily Briefing on Real Vision
June 22: Forex Premarket Show with Dale Pinkert
June 23: Your Daily Five on StockCharts TV
ETF Summary
S&P 500 (SPY): August 2022 high 431.73, and of course 420 now key.Russell 2000 (IWM): 180 now must hold while still miles from its 23-month MA 193.Dow (DIA): 23-month MA 337 pivotal and closed right there.Nasdaq (QQQ): Big correction as Canada hikes rates; also somewhat saturated index. 350 pivotal with the close below.Regional Banks (KRE): 45.50 significant resistance.Semiconductors (SMH): 142.50 the 10-DMA; if breaks, still looking at 138-140.Transportation (IYT): 233.50 is significant resistance.Biotechnology (IBB): 121-135 range.Retail (XRT): 60 now support and 63 resistance.
Mish Schneider
MarketGauge.com
Director of Trading Research and Education

