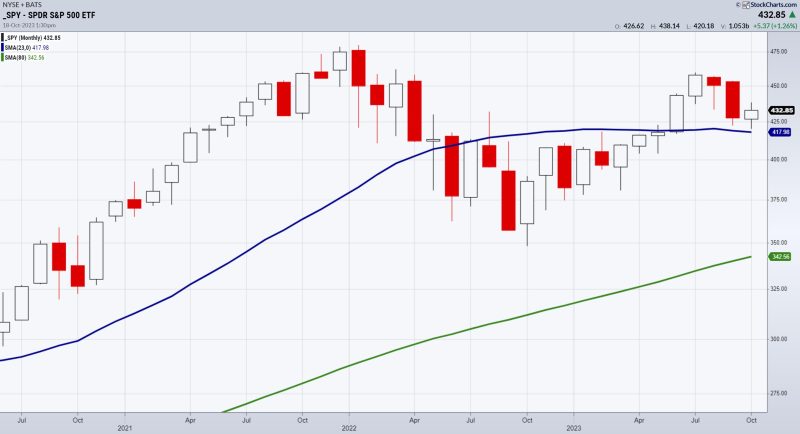
CHART 1: MONTHLY CHART OF SPDR S&P 500 ETF (SPY).
Considering everything:
Yields and mortgage rates War Inflation and rising commodity prices Bank stocks falling Risk Gauges: 2 out of 6 now risk-off
To name a few, why, then is the S&P 500 so strong?
Here are a few reasons:
Fed members suggest rate hike pauses. Hope that the war lateralizes rather than escalates. Economy stats mixed with retail sales and labor strong. Sidelined cash in money markets could move into equities. Seasonally, Q4 and pre-election years are historically strong.
Besides the SPY chart, we also watch the price in small caps.
I feel like I have written the same themes repeatedly. It’s almost like a mantra:
“Watch price and timeframe in the Economic Modern Family.
Watch commodities.”
Watch risk gauges.”
And here we are still stuck in time as time seemingly stands still amidst the increasingly faster speed and plethora of news.
The SPY monthly chart is not bearish.
It could turn out that way, but presently, SPY sits atop the blue line or 23-month moving average (MA).
We have two weeks left in October, so we are watching the 418 level carefully.
We are also carefully watching 450 as resistance.
After all, a trading range is not only possible but also plausible.
CHART 2: MONTHLY CHART OF ISHARES RUSSELL 2000 ETF.
Small caps look more vulnerable.
Hence, we look to them to tell us what’s next.
The Negatives:
A declining slope on the 23-month MAA narrowing between the 23 and 80-month MAsAn unimpressive bounce off the 80-month MA (green line).
The Positives:
IWM is still above the 80-month MAHis wife, Granny Retail XRT is potentially making triple bottoms off the October 2022 lows.
The Bottom Line: Tune out the noise and follow the charts.
This is for educational purposes only. Trading comes with risk.
If you find it difficult to execute the MarketGauge strategies or would like to explore how we can do it for you, please email Ben Scheibe at Benny@MGAMLLC.com, our Head of Institutional Sales. Cell: 612-518-2482.
For more detailed trading information about our blended models, tools and trader education courses, contact Rob Quinn, our Chief Strategy Consultant, to learn more.
“I grew my money tree and so can you!” – Mish Schneider
Get your copy of Plant Your Money Tree: A Guide to Growing Your Wealth.
Grow your wealth today and plant your money tree!
Follow Mish on Twitter @marketminute for stock picks and more. Follow Mish on Instagram (mishschneider) for daily morning videos. To see updated media clips, click here.
Mish in the Media
In this video, Mish talks about trading Garmin Ltd. (GRMN) on Business First AM.
Mish and Dale Pinkert discuss the disconnect between news and markets-and how to best invest right now in this video from ForexAnalytix’s pre-market show.
In this video from CMC Markets, Mish shares her short-term forecast for USD/JPY and popular commodity instruments ahead of the US PPI announcement and September’s Fed meeting minutes, with recent dovish comments from Fed officials suggesting a potential shift in the committee’s policies.
Mish joins Business First AM to discuss the market reaction to the war in Gaza in this video.
Mish discusses what’s needed for a market bottom on the Financial Sense Newshour podcast with Jim Puplava.
Mish takes over as guest host for David Keller, CMT on the Monday, October 9 edition of StockCharts TV’s The Final Bar, where she shares her thoughts in the daily Market Recap during a day of uncertain news.
To quote Al Mendez, “The smartest woman in Business Analysis @marketminute [Mish] impresses Charles with her “deep dive” to interpret the present Market direction.” See Mish’s appearance on Fox Business’ Making Money with Charles Payne here!
Mish covers bonds, small caps, transports and commodities-dues for the next moves in this video from Yahoo! Finance.
In this video from Real Vision, Mish joins Maggie Lake to share what her framework suggests about junk bonds and investment-grade bonds, what she’s watching in commodity markets, and how to structure a portfolio to navigate both bull and bear markets.
Mish was interviewed by Kitco News for the article “This Could Be the Last Gasp of the Bond Market Selloff, Which Will be Bullish for Gold Prices”, available to read here.
Mish presents a warning in this appearance on BNN Bloomberg’s Opening Bell — before loading up seasonality trades or growth stocks, watch the “inside” sectors of the US economy.
Watch Mish and Nicole Petallides discuss how pros and cons working in tandem, plus why commodities are still a thing, in this video from Schwab.
Coming Up:
October 19: Live Coaching
October 20: StockCharts TV’s Your Daily Five
October 20: Crypto Town Hall X Spaces
October 23: BNN Bloomberg
October 27: Live in-studio with Charles Payne, Fox Business
October 27: Live in-studio with Yahoo Finance!
October 27: Recorded in-studio with Investor’s Business Daily
October 29-31: The Money Show
Weekly: Business First AM, CMC Markets
ETF Summary
S&P 500 (SPY): 440 resistance, 429 support.Russell 2000 (IWM): 177 resistance, 170 KEY support.Dow (DIA): 344 resistance, 332 support.Nasdaq (QQQ): 368 resistance, 363 supportRegional Banks (KRE): 39.80 -42.00 range.Semiconductors (SMH): 150 resistance, 140 support.Transportation (IYT): 237 resistance, 225 support.Biotechnology (IBB): 120-125 range.Retail (XRT): 57 key support if can climb over 61, better.
Mish Schneider
MarketGauge.com
Director of Trading Research and Education


