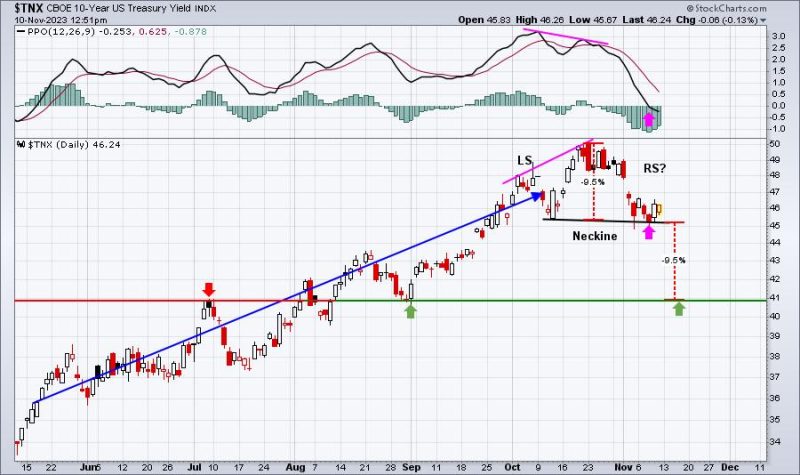
I’ve already pointed out that I believe the July through October correction is over. I’m sticking to my earlier convictions that we’ll experience a very strong finish in 2023, breaking out to all-time highs later in Q4 or sometime in Q1 2024. Growth continues to power forward and, after a potential right shoulder forms, I’m looking for the 10-year treasury yield ($TNX) to further support a strong Q4 finish by breaking down out of its topping head & shoulders pattern:
A symmetrical head & shoulders topping pattern would print if the TNX reaches 4.80% – equal to the 4.80% top at the left shoulder. A pattern doesn’t have to be symmetrical, but if it is, more technical traders will recognize and act upon it. As you can see, the measurement would likely take the TNX back to 4.10%, or thereabouts. Perhaps this is one reason why traders are jumping all over the growth-oriented NASDAQ 100 ($NDX) right now:
Today’s price action has easily cleared Point 4 price resistance, effectively ending the downtrend since July. This confirms my earlier signals that told me this correction would not last and certainly wouldn’t morph into bear market selling to take us back to the October 2022 low. Also, check out the RSI panel at the bottom of the chart. RSI 60 can serve as a brick wall of resistance when we’re downtrending, but history tells us that when the RSI pushes through 60, there are much stronger odds that the downtrend has ended and a new uptrend has started.
As the NDX has made a key reversal, I generally find it helpful to see which stocks are showing strength and providing leadership. Over the past month, here are the Top 10 stocks in the NASDAQ 100:
The 3rd stock on this list, Broadcom, Inc. (AVGO) is worth discussing further. Recently, I published a PDF that provides anyone interested in the historical pattern of the S&P 500 during the current secular bull market (since 2013) and how 16 individual stocks have fared as well. AVGO is one stock that LOVES the second half of Q4, probably because it runs higher into its quarterly earnings report. Unlike many of the stocks on the NDX, AVGO reports in the 3rd calendar month of each quarter, so their pre-earnings run typically occurs later than others. I believe that pre-earnings run is underway right now:
Semiconductors ($DJUSSC) are trying to break out and AVGO happens to be one of the leaders driving prices higher in this industry. Given its historical bullishness into earnings and today’s breakout, if it holds, I see AVGO running higher. Seasonal trends, while not my primary reason for buying and selling, do offer us up information that most traders don’t have access to. Be prepared.
If you’d like to claim your FREE COPY of my Bowley Trends seasonal PDF, it’s very simple. CLICK HERE to provide your name and email address. Be sure to hit that Download button and we’ll immediately send you what I believe will be a major game changer. You won’t ever look at the stock market the same. Get back at the big, manipulative Wall Street firms and understand their tricks, so that you too can profit from them!
Happy trading!
Tom

