Usually, I would do this week’s Sector Spotlight on the completed monthly charts for November. But as we are gearing up for episode 200, I wanted to make it a bit more special. So what to do?
As I will be visiting the StockCharts.com office in Redmond next week, it made sense to skip this week’s regular episode and record the 200th episode in the studio next week. So, in case you were wondering why there was no SSL episode this week as usual… now you know
At the moment, the plan is to record the show on Tuesday morning PT and hopefully have it uploaded by the end of the day.
However, we still need to do a, quick, review of the monthly charts and highlight a few observations.
Monthly Rotation
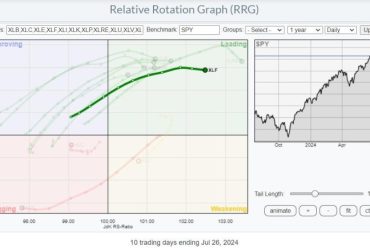
The monthly RRG shows a very clear rotational picture. Technology ($SPT), Communication Services ($SPTS), and Consumer Discretionary ($SPCC) are either inside the leading quadrant or inside, improving and heading toward leading. All three are on a strong RRG-Heading between 0-90 degrees.
ALL other sectors are inside lagging or inside weakening and heading toward lagging, and ALL are on a negative RRG-Heading. A very distinct rotational sequence in opposite directions.
This leaves little doubt as to which sectors are currently leading the market.
Technology
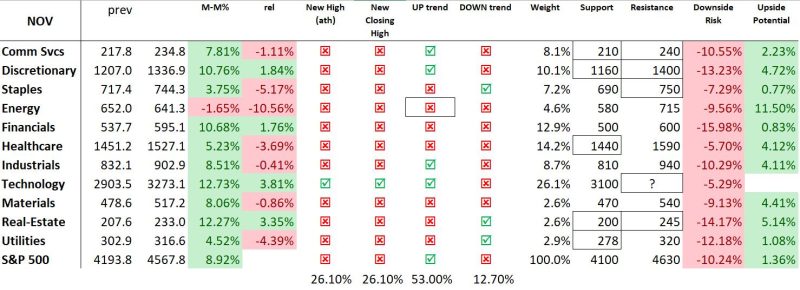
The technology sector is the only sector that recently broke to new all-time-high levels and is managing to hold there. Despite the strong rally it has already gone through, this remains one of the strongest sectors within the S&P 500 universe.
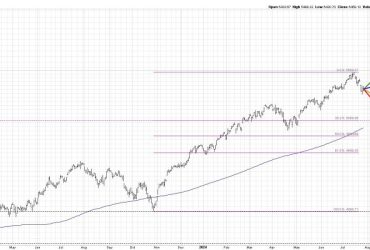
The monthly chart shows. how, last month, $SPT managed to take out its previous high (July) and close and finished the month of November at the highest monthly close ever. That is not a weak characteristic.
This means there is now no real upside target as we are in “uncharted” territory, while the recent resistance area, around 3100, can now be expected to serve as support.
Communication Services
This sector bounced against overhead resistance in the 240-245 area, which is the level of the Match/April high. This can cause some short-term hesitation and keep $SPTS under pressure for a little while, but the series of higher highs and higher lows is still intact.
Combined with the strong rotation on the RRG, this makes Communication Services still one of the stronger sectors.
Consumer Discretionary
The third sector pushing toward the leading quadrant is consumer discretionary, the fourth largest sector in terms of market cap and one of the larger sectors in terms of constituents.
After testing resistance near 1400 a few months ago, the sector dropped back to form a new, higher low at 1160. Out of that recent low $SPCC is now underway toward the 1400 area again. A break beyond that supply zone will very likely trigger a renewed acceleration to higher levels.
45% of market capitalization showing strength
All in all, that means that. roughly 45% of the total market cap is now at a positive RRG-Heading on the Relative Rotation Graph while holding up well on the price charts. This should give the market a solid base for further gains going into the new year.
Energy
On the opposite side of the RRG, the energy sector has the longest 12-month tail, showing a large and rapid rotation from high up in the leading quadrant all the way to low levels in the weakening quadrant and almost crossing over into lagging.
The accompanying price movement shows a third attempt by $SPEN to take out overhead resistance near 715-725, after which the price has started to move lower and seems to be heading toward the lower boundary of a range between 57-575 and 715-725.
Because of this move, I have changed the trend for this sector from Up to Sideways. I think the mentioned support area is extremely important. If that level gives way, it means that a massive double top will be completed, providing a potential downside target well below 400.
That has not happened yet, and it will likely not happen overnight or next week, but we better be prepared because it looks significant, so be careful.
#StayAlert, –Julius


