I’m going to start this article a bit different than all the others I’ve written here at StockCharts.com and talk off topic for a paragraph or two.
I grew up in Maryland, quite close to Washington, DC, and was an avid Washington Redskins and Baltimore Orioles fan. I look back now and feel very fortunate that I was able to follow two sports teams that enjoyed decades of success, though both organizations faltered for many years to follow under less-than-desirable ownership. But during the 1960s, 1970s, and 1980s, these two sports organizations won several championships and constantly competed for more. It started with the owners and the culture they built. They hired the right people to build from the ground up and eventually hired two “on-the field generals” that the entire community could embrace. I know I’m a “homer”, but Earl Weaver (Baltimore Orioles Manager from 1968-1982 and also one other year – 1985) and Joe Gibbs (Washington Redskins Head Coach from 1981-1992 and 2004-2007) were two leaders that I immediately respected. I admired Earl Weaver as one of the pioneers of using analytics in his decision-making and he influenced my career as I’ve become quite the stock market historian over the years. Weaver platooned outfielders, depending on pitching matchups, and was one of the first managers to use late inning relief pitchers to seal victories. I’m a “numbers guy” and always have been and I use similar “historical matchups” in the stock market. The use of analytics just makes perfect sense to me.
Joe Gibbs, to this day, is one of my favorite human beings ever. He’s a man of high character, integrity, faith, and family. He is unquestionably a leader, as evidenced by his NFL coaching career, and later, his NASCAR career. He’s simply a winner. His players would run through brick walls for him. He had conviction and he was innovative. Do you know who started the “one-back” set? Counter trey? During his first year as head coach of the Redskins, he started 0-5 before finishing the season on an 8-3 run. The next season, he won his first Super Bowl. He became the only NFL coach in history to win 3 Super Bowls with 3 different starting quarterbacks. Conviction and innovation matter.
These two sports teams and these two coaches, in particular, were of great inspiration to me. They were perfect examples of how to gain an edge on your competition and how you do things the right way.
When I had the opportunity to join the StockCharts.com “team” nearly two decades ago after ending my public accounting career and founding EarningsBeats.com (formerly Invested Central), I jumped at it. Partnering with StockCharts just felt right and we’ve never looked back. While StockCharts.com offers a great trading & tools platform at various price points, they also place a huge emphasis on research and education, two of our three pillars at EarningsBeats.com. I am mostly a self-taught technician as I like to do my own independent research. But I’ve always been a fan of John Murphy’s work and books. Since John was part of the StockCharts team, this was a perfect match for me and EarningsBeats. From its very beginning, StockCharts has boasted a top-notch ChartSchool, providing FREE education, which I use myself from time to time. I’d encourage you to use it, if you haven’t already. There’s a wealth of information and education for both traders and investors. To some degree, EarningsBeats.com has a similar approach. While we charge for much of our market guidance, research, and education, we also provide plenty of FREE information to investors and traders seeking a better and more secure financial future. My Trading Places blog right here at StockCharts is a perfect example, as are my YouTube shows. We also have a FREE EB Digest at EarningsBeats where I produce an educational chart (and two paragraphs) 3x per week. Be sure to subscribe to that with your name and email address if you haven’t already.
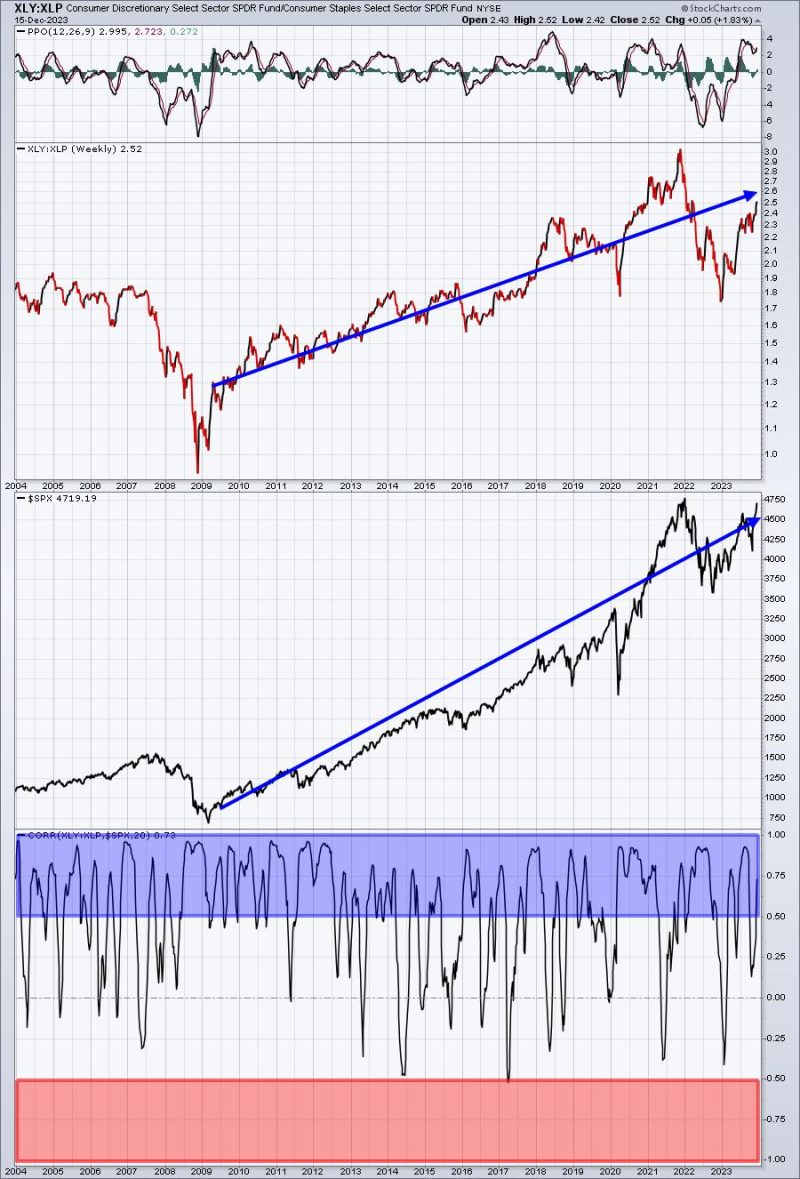
In putting YOUR team, that YOU trust, together, I’d encourage you to start with StockCharts.com. I have worked with many of the contributors here at StockCharts and know many of them personally as well. Collectively, it’s a group with high character and integrity with education as a top priority. They provide a TON of free content and you should take advantage of it. Find those that you trust and employ similar strategies to your own, and build the rest of your team from there. In my mind, that’s where a team should start – those who provide education and do their own independent research. That also means IGNORING those that have an agenda, which I’d estimate is roughly 90% of the folks you’ll see on CNBC. We’ve had three (3!!!!!!!!) market crashes in my lifetime, which now spans more than six decades. How can you explain CNBC parading the same group of people across their channel that continue to provide HORRIBLE forecasts year in and year out? There are those that constantly spew a “CRASH” is coming. During my lifetime, the odds of one occurring is about 1 in 20 years. There’s definitely a core cast of “influencers” on CNBC and who knows what their agenda is. I just TURN IT OFF. It is so easy to be swayed when you hear over and over again how awful the economy is. How the debt level is out of control. How higher interest rates will crush the economy. (By the way, now I’m hearing from some folks how the Fed turning dovish is bearish for stocks, too!) You can’t make this stuff up. I’ve “learned” that when the market goes up and breadth is poor, it’s a signal that there’s little participation and we shouldn’t trust the advance. But when breadth is strong, it’s an extreme that marks a top. In other words, SELL if you ever look at breadth, no matter what it shows. Also, if you haven’t heard, a massive recession is coming. That helps to explain why money has been rotating heavily towards consumer discretionary (XLY) vs. consumer staples (XLP) and is currently at a 2023 high – I’m fluent in sarcasm, by the way:
Through all of my years of learning and research, the one chart that I love, perhaps more than any other, is the XLY:XLP ratio. It just makes perfect common sense, right? If our economy is two-thirds consumer spending and the stock market is the best leading economic indicator, then wouldn’t following a ratio between the offensive consumer discretionary sector (which would presumably do much better in a strong or strengthening economy) and the defensive consumer staples sector just make absolute perfect sense. Look at the correlation coefficient between the S&P 500 and the XLY:XLP ratio in the bottom panel of the chart above. Strong positive correlation is represented by readings > +0.50 and strong inverse correlation is represented by readings < -0.50. This isn’t an opinion of mine. This is an absolute FACT and you can see it clearly on the chart. The XLY:XLP ratio can help us determine if we should expect a current trend in the S&P 500 to continue. It’s my favorite “sustainability” ratio. So when I hear analysts, or anyone for that matter, talk about an impending recession in 2024, I have to disagree. Sorry, not sorry. It helps me ignore all the worries on CNBC and have CONVICTION in my own beliefs.
Conviction matters.
On Monday, December 18th, at 4:30pm ET, I’ll be hosting an event, “The Stock Market & Interest Rates: What History Tells Us.” This is a chance to finish off 2023 by gaining more knowledge about the relationship between the direction of interest rates and the direction of U.S. stock prices. It’ll be one of the many key factors in 2024 stock market performance, so it’s a topic that everyone should understand now. This is a Members-Only event, but a 30-day FREE trial gets you a seat to the event and an opportunity to kick the tires of EarningsBeats.com.
For more information and to start your FREE 30-day trial, CLICK HERE. (Be sure to scroll to the bottom of the form for sign up)
Happy trading!
Tom

