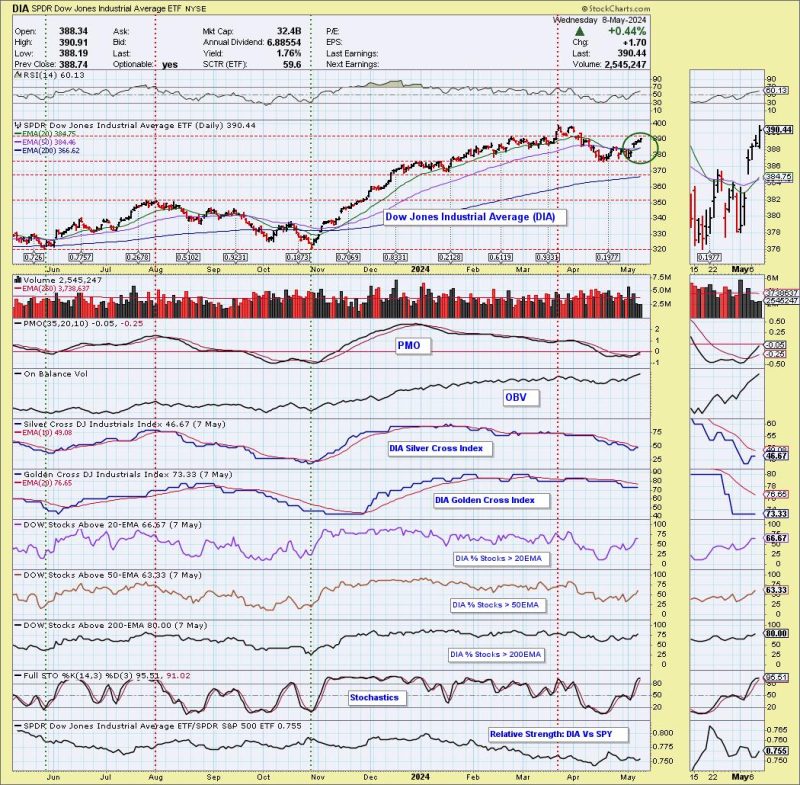
The Dow Jones Industrial Average ETF (DIA) 20-day EMA crossed up through the 50-day EMA (a Silver Cross), generating an IT Trend Model BUY Signal. The Dow saw a better rally today than the SPY, but under the hood it isn’t quite as strong as the SPY. We do still have participation readings above our bullish 50% threshold with the exception of the Silver Cross Index. It should be able to get above its signal line soon if participation readings hold up. Remember, the Silver Cross Index tells us how many stocks have a “Silver Cross” within the index. Those stocks have a bullish bias in the intermediate term. (To see the “under the hood” chart of the SPY, you can become a member of DecisionPoint.com for access to it and all other major indexes, sectors and select industry groups.)
The weekly PMO is decelerating, but is still holding a Crossover SELL Signal. This looks like a good rally, but expectations should be tempered based on the weekly chart.
The Russell 2000 ETF (IWM) 20-day EMA crossed up through the 50-day EMA (Silver Cross), generating an IT Trend Model BUY Signal. It was not a good Wednesday for small-caps, but given price is above the 20/50-day EMAs, we still got the Silver Cross. The PMO has just reached above the zero line, but we don’t like the weakness we are seeing already in price as it topped.
IWM has been mostly range bound and right now it is at the top of the range, making it vulnerable. The weekly PMO is on a relatively new Crossover SELL Signal. We would be careful with this group.
Learn more about DecisionPoint.com:
Watch the latest episode of the DecisionPointTrading Room on DP’s YouTube channel here!
Try us out for two weeks with a trial subscription!
Use coupon code: DPTRIAL2 at checkout!
Technical Analysis is a windsock, not a crystal ball. –Carl Swenlin
(c) Copyright 2024 DecisionPoint.com
Disclaimer: This blog is for educational purposes only and should not be construed as financial advice. The ideas and strategies should never be used without first assessing your own personal and financial situation, or without consulting a financial professional. Any opinions expressed herein are solely those of the author, and do not in any way represent the views or opinions of any other person or entity.
DecisionPoint is not a registered investment advisor. Investment and trading decisions are solely your responsibility. DecisionPoint newsletters, blogs or website materials should NOT be interpreted as a recommendation or solicitation to buy or sell any security or to take any specific action.
Helpful DecisionPoint Links:
Price Momentum Oscillator (PMO)


