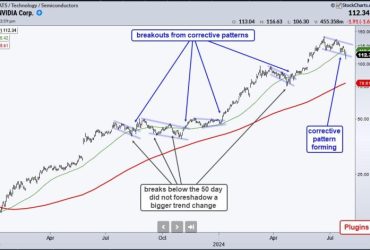
In this edition of StockCharts TV‘s The Final Bar, Dave recaps a day where technology shares struggles, with leading names like NVDA and MU dropping bearish engulfing patterns to indicate short-term distributions. He also addresses the ongoing divergence between large caps and small caps, the upside potential for energy stocks, and a bullish divergence for GILD.
See Dave’s chart showing a bearish candle pattern for QCOM here.
This video originally premiered on June 20, 2024. Watch on our dedicated Final Bar page on StockCharts TV!
New episodes of The Final Bar premiere every weekday afternoon. You can view all previously recorded episodes at this link.


