The Volatility Index ($VIX) is one of my key sentiment indicators and it has a history of accurately predicting corrections and bear markets. We’ve had neither without the VIX first clearing an important hurdle in the 17-20 range. Bear markets require a huge dose of fear and panic and the VIX acts as our stock market meteorologist – one that predicts major market storms as they’re approaching. Throughout this entire secular bull market, the S&P 500’s poor periods of performance have been marked by VIX readings above 20. Rather than repeat these results in this article, you can check out a Trading Places article that I wrote in November 2023, “What Are The Chances Of A Market Crash? This Indicator Says ZERO!”
On recent Trading Places Live YouTube shows and in my regular emails to our EB.com members, I’ve consistently discussed the significant increase in risk that accompanies a VIX close above 20. I do not take it lightly and neither should you. But check out what happened over the past few weeks as the VIX spiked and neared 20:
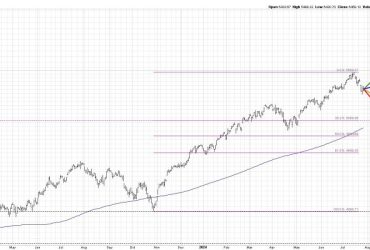
We had a straight-up move off the October 2023 low and the above chart simply reeks of slowing bullish momentum throughout the second half of Q1. I expected March weakness, but it was delayed into April. That final move lower in October was characterized by the big VIX increase – ultimately with closes on the VIX above 20. Once that VIX returned below 17, the selling and correction was over and the bull market resumed. Hence, the reason for my November article linked above.
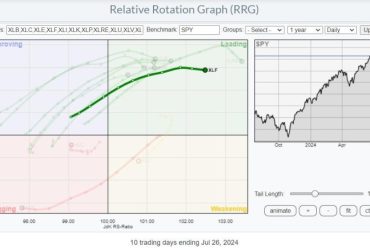
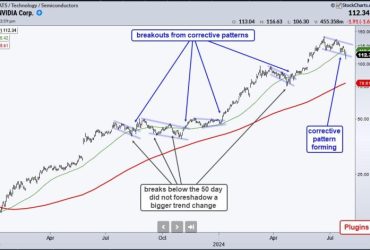
When I evaluate a bounce like the one we had last week, I like to see if there’s a resumption of the “risk on” market environment. Here are a few ratios that I like to follow and how they responded during the bounce:
These 3 ratios all bounced higher with the S&P 500, but all remain in downtrends that began before the S&P 500 selling did. That tells me that “risk off” still remains in play to some degree and we’ll need further confirmation that a short-term bottom is in play. IF we do turn lower again, watch the VIX. If we see fresh new lows on the S&P 500 and the fear dissipates (ie, VIX remains below 20), I’d view that as a positive signal.
Over the past two weeks, I’ve shared my best upcoming earnings reports in the finance and industrials sectors. They both (AXP and GE) saw very strong reactions to their quarterly results. Tomorrow morning, I’ll share my top technology pick with our FREE EB Digest newsletter subscribers. If you haven’t already subscribed and you’d like to see the technology company that I believe will report blowout quarterly results ahead, simply CLICK HERE and enter your name and email address. There’s no credit card required and you may unsubscribe at any time.
Have a great week ahead and happy trading!
Tom


