Before we begin, just a note to mention that TLT took out the fast MA featured in the October 10th daily, while SPY underperformed. If that is a trend, it behooves you to review that daily.
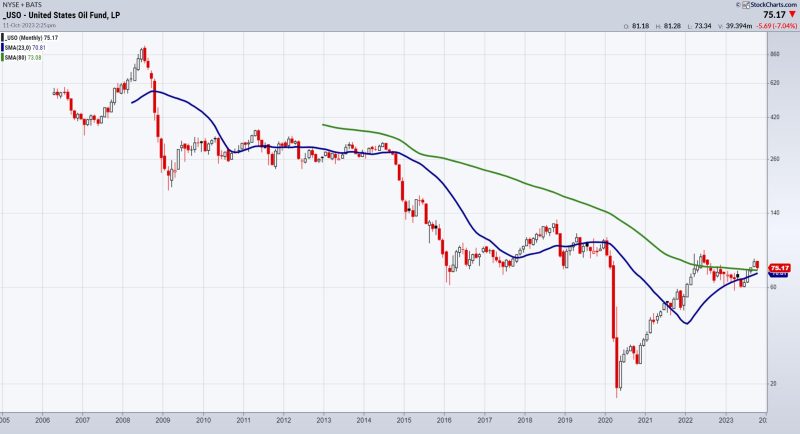
Loyal readers of the Daily know that we often focus on zooming out to longer timeframes to assess bigger trends. Clearly, the 80-month moving average in small caps and retail has become an important support “line in the sand” to measure the potential for recession and/or stagflation. In the case of the chart of USO (US Oil Reserves), the 80-month moving average is a line in the sand to measure the inflation narrative or higher oil prices likely coming.
Historically, the 80-month moving average (green line) served as resistance in USO since 2008 when the market crashed. Then, from March 2022 until July 2022, USO traded above the 80-month MA. However, that was short-lived thanks to rising interest rates.
3 months ago, that changed. Once oil cleared $80 a barrel, we saw the price spike to about $94.00. USO then cleared the 80-month MA in August on the heels of OPEC+ and the US dwindling oil reserves, plus higher-than-expected demand. The oil market appears to have priced in current interest rate values.
Although the current geopolitical situation is not a pure impact on oil prices, what the chart suggests is that lack of impact can reverse to a much larger impact. The USO price closed the month of September at 76.00. This month, USO opened higher. Currently, the price is above the 80-month, but slightly below a pivotal point at 76.00.
Quite simply, a move over 76 suggests higher prices with a good risk point to under 73 or the 80-month MA. That would correspond with oil holding $80 per barrel and returning above $86.00. More importantly, if the trend is your friend, this break higher of the 6-7 year business cycle, if it sustains, should drive oil prices to the next target of around $110.
Please join Geoff Bysshe on Wednesday October 11th at 8 PM ET as he reveals the 3 most important principles behind the success I have enjoyed as a veteran trader.
Tired of looking for shortcuts to trading that only lead to fleeting success? This webinar is for you!
This is for educational purposes only. Trading comes with risk.
For more detailed trading information about our blended models, tools and trader education courses, contact Rob Quinn, our Chief Strategy Consultant, to learn more.
If you find it difficult to execute the MarketGauge strategies or would like to explore how we can do it for you, please email Ben Scheibe at Benny@MGAMLLC.com.
“I grew my money tree and so can you!” – Mish Schneider
Get your copy of Plant Your Money Tree: A Guide to Growing Your Wealth and a special bonus here.
Follow Mish on Twitter @marketminute for stock picks and more. Follow Mish on Instagram (mishschneider) for daily morning videos. To see updated media clips, click here.
Mish in the Media
In this video from CMC Markets, Mish shares her short-term forecast for USD/JPY and popular commodity instruments ahead of the US PPI announcement and September’s Fed meeting minutes, with recent dovish comments from Fed officials suggesting a potential shift in the committee’s policies.
Mish joins Business First AM to discuss the market reaction to the war in Gaza in this video.
Mish discusses what’s needed for a market bottom on the Financial Sense Newshour podcast with Jim Puplava.
Mish takes over as guest host for David Keller, CMT on the Monday, October 9 edition of StockCharts TV’s The Final Bar, where she shares her thoughts in the daily Market Recap during a day of uncertain news.
To quote Al Mendez, “The smartest woman in Business Analysis @marketminute [Mish] impresses Charles with her “deep dive” to interpret the present Market direction.” See Mish’s appearance on Fox Business’ Making Money with Charles Payne here!
Mish covers bonds, small caps, transports and commodities-dues for the next moves in this video from Yahoo! Finance.
In this video from Real Vision, Mish joins Maggie Lake to share what her framework suggests about junk bonds and investment-grade bonds, what she’s watching in commodity markets, and how to structure a portfolio to navigate both bull and bear markets.
Mish was interviewed by Kitco News for the article “This Could Be the Last Gasp of the Bond Market Selloff, Which Will be Bullish for Gold Prices”, available to read here.
Mish presents a warning in this appearance on BNN Bloomberg’s Opening Bell — before loading up seasonality trades or growth stocks, watch the “inside” sectors of the US economy.
Watch Mish and Nicole Petallides discuss how pros and cons working in tandem, plus why commodities are still a thing, in this video from Schwab.
Coming Up:
October 11: CNBC Asia
October 12: Dale Pinkert, F.A.C.E.
October 27: Live in-studio with Charles Payne, Fox Business
October 29-31: The Money Show
Weekly: Business First AM, CMC Markets
ETF Summary
S&P 500 (SPY): 435 resistance.Russell 2000 (IWM): 177 resistance.Dow (DIA): 338 resistance.Nasdaq (QQQ): 368 pivotal.Regional banks (KRE): 39.80-42.00 range.Semiconductors (SMH): 150 resistance, 143 support.Transportation (IYT): 237 resistance, 225 support.Biotechnology (IBB): 120-125 range.Retail (XRT): 57 key support; if can climb over 61, bullish.
Mish Schneider
MarketGauge.com
Director of Trading Research and Education

